Projections is a performance analysis/visualization framework that helps you understand and investigate performance-related problems in your parallel (CHARM++) application. It is a framework with an event tracing component with features that allow you to control the amount of information generated and to a lesser degree the amount of perturbation the tracing activities introduce into the application. It also has a Java-based visualization and analysis component with various views that will help present the performance information in a visually useful manner. The research page can be found here.
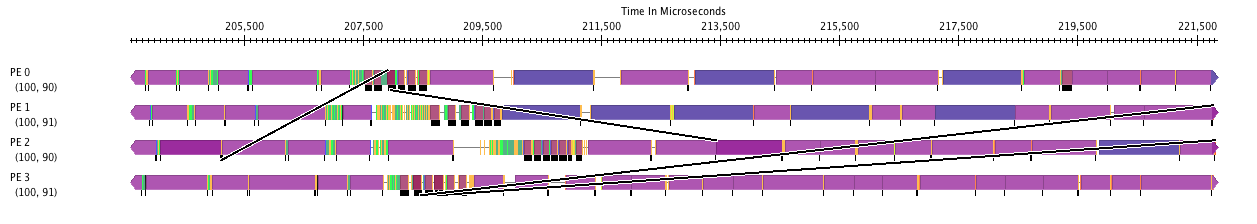
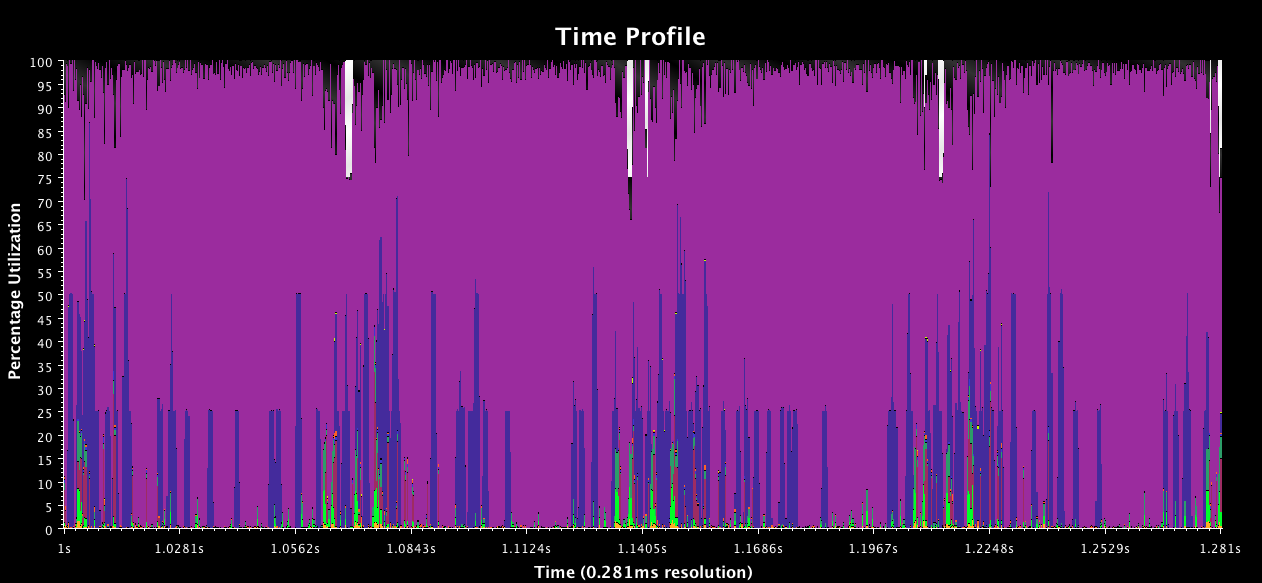
The above two figures show the timeline and time-profile view in Projections. In the timeline view, user can see the messages between processors. In the time-profile view, user can observe the usage of the application as time goes by.
The latest development version of Projections can be downloaded directly from our source archive. The Git version control system is used, which is available from here.
Check out Projections from the repository:
git clone https://github.com/UIUC-PPL/projections
This will create a directory named projections. Move to this directory:
Charm++ offers a variety of parallel debugging options, from the extremely basic to the extremely sophisticated. The traditional debugging methods, such as logging (via the CkPrintf routine) and interactive debugging (via the "++debug" command line option) are supported under Charm++.
In addition, Charm++ offers several additional features designed to simplify application development. Linking with "-memory paranoid" checks all dynamic heap allocation calls for common errors, such as double-delete, random-delete, read-after-delete, buffer over- and under-write errors. Charm++, when compiled without "-DCMK_OPTIMIZE", contains hundreds of assertions to catch invalid parameters and uninitialized data passed to API routines.
Charm Debug is a sophisticated parallel debugger, with the ability to
set breakpoints, examine variables, objects, and messages across the
entire machine. The design of this debugger is described in the research page.
The latest development version of Charm Debug can be downloaded directly from our source archive. The Git version control system is used, which is available from here.
Check out Charm Debug from the repository:
git clone https://github.com/UIUC-PPL/ccs_tools
This will create a directory named ccs_tools. Move to this directory: